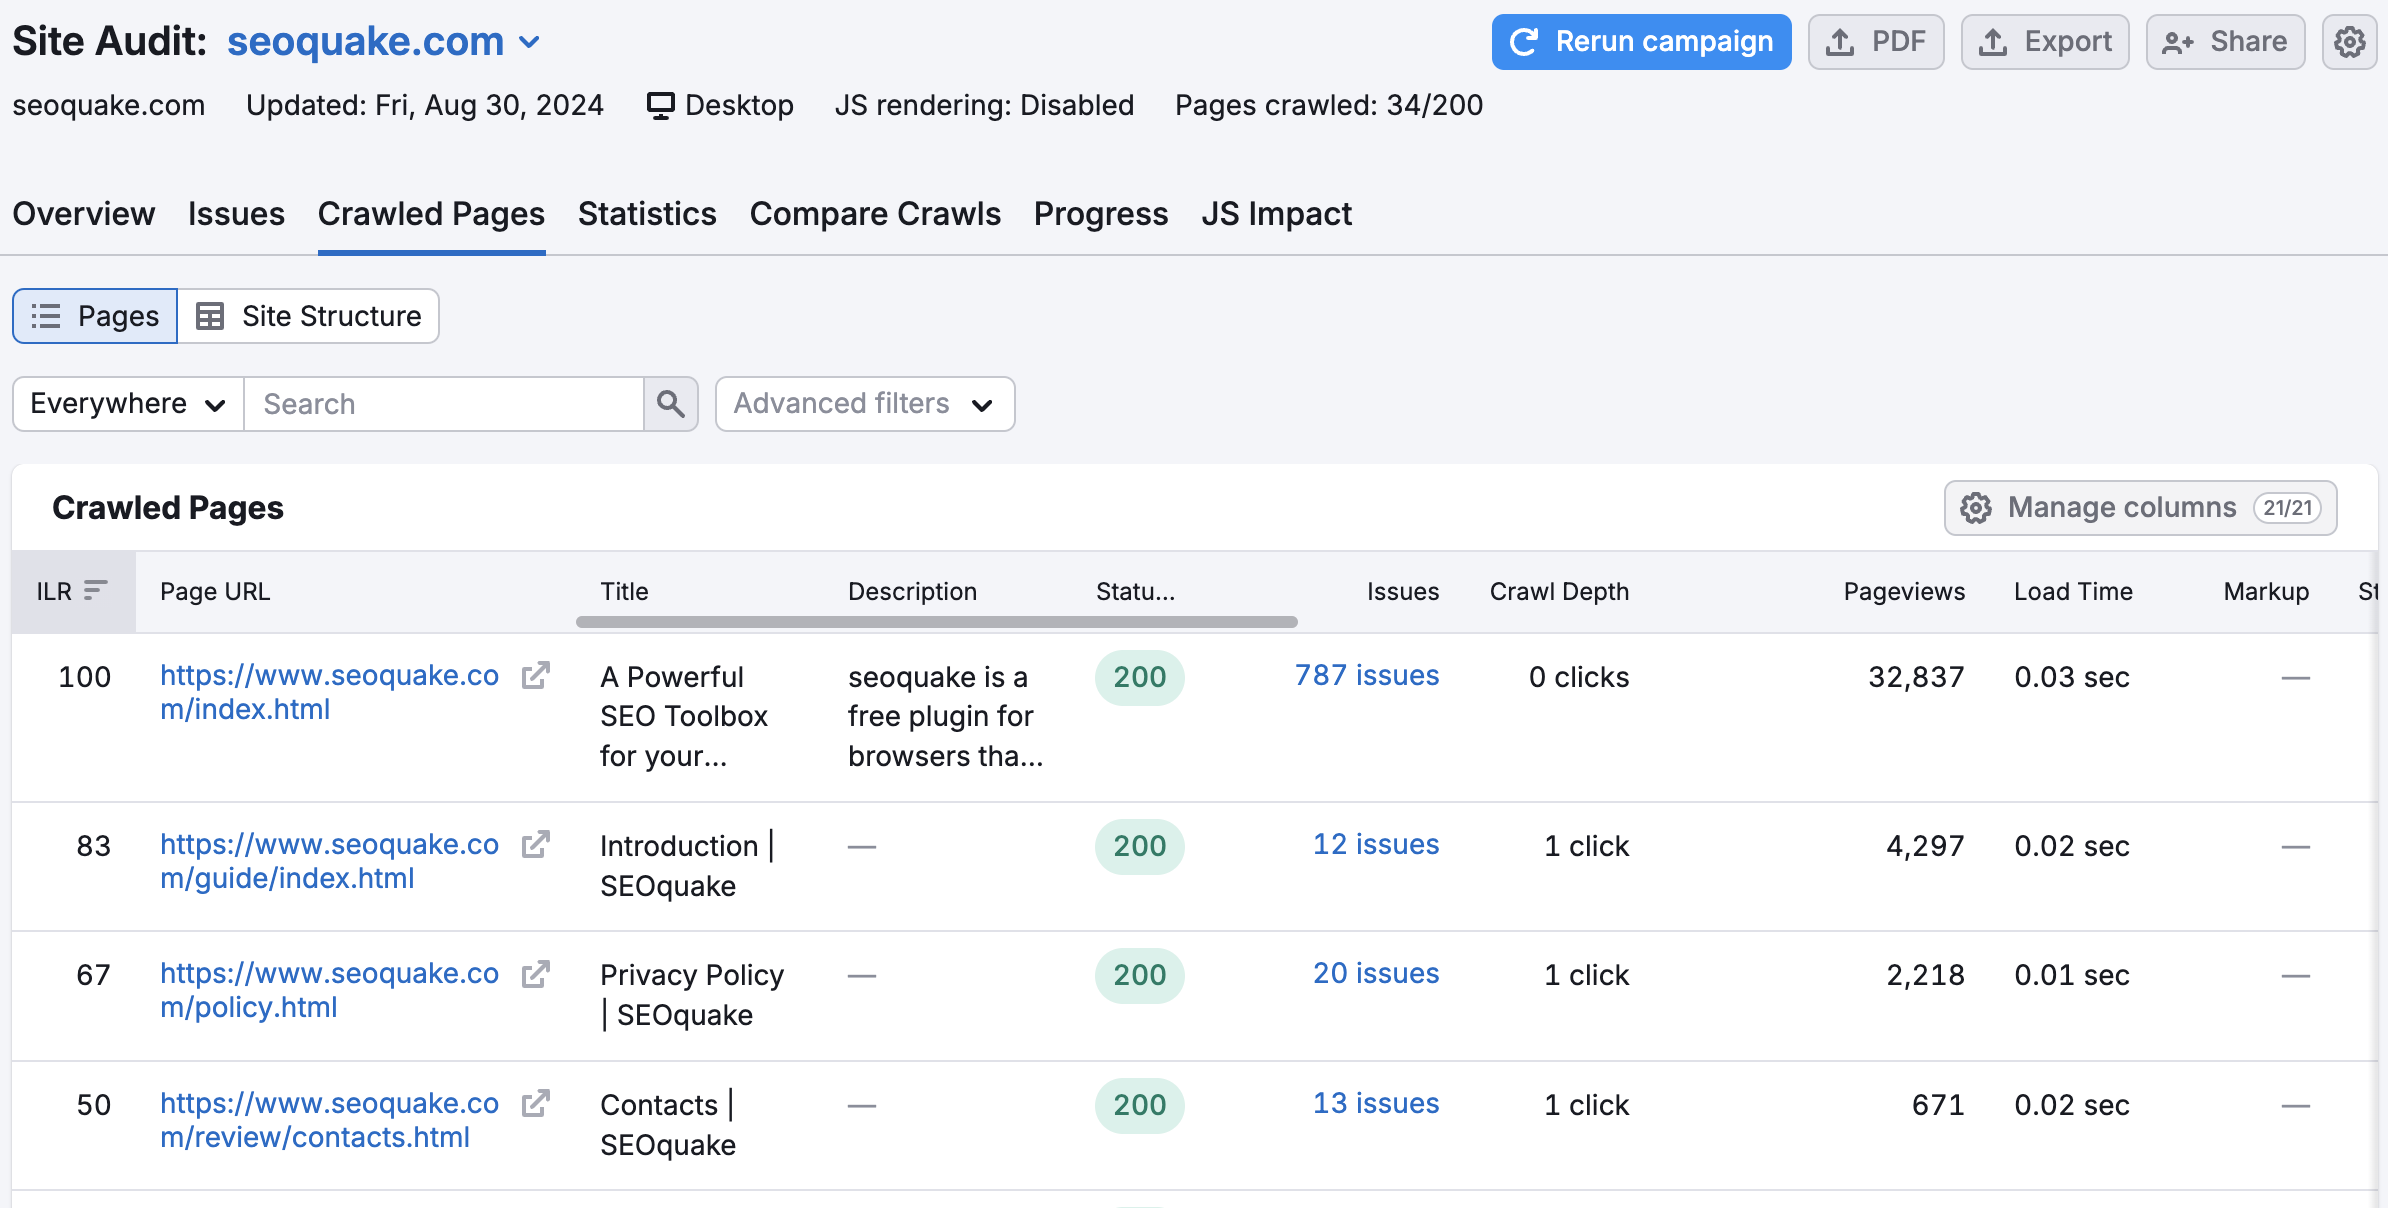
The Crawled Pages section of your Site Audit lists all URLs crawled by our bot. This gives you an easy way to find every page on your site that was crawled and analyze the status of your website on a page-by-page basis.
Crawled Pages Table

Here are the elements of the report that you can choose to include using the Manage column button (please see below for details):
- The page’s Internal LinkRank
- Page URL
- Title
- Meta description
- HTTP status code
- Total number of issues
- Page’s crawl depth
- Number of unique pageviews
- Page (HTML) Load Time
- Markups
- Structured data items
- Canonicalization
- Sitemap presence
- Incoming internal links
- Outgoing internal links
- AMP link
- Hreflang usages
- JS and CSS files
- JS and CSS size
To work through this report, you can filter the pages by URL or, for example, by status (pages with issues, broken pages, redirects, blocked pages, and healthy pages). You can also combine multiple filters at once to get the desired results.
For example, two filters should be added to the report to locate pages that have issues and an Internal LinkRank of over 70 (see below). Then, you can sort the pages by unique pageviews and fix the most important first.

To re-crawl a specific page, click on the circular icon in the far-right-hand column under the Reaudit. This will send our crawler to just that one page to check for issues. This is an efficient way to follow the progress of site maintenance without using up an unnecessary amount of your crawl budget.

To see your account’s crawl budget, go to your Subscription Info Summary and look for “Pages to crawl.”
Why are these page attributes important for SEO?
Crawl depth of a page refers to the number of clicks needed to reach a specific page from the domain’s homepage using the shortest path. The homepage will have a depth of 0 and any page linked from the homepage has a depth of 1.
For the most important content on your website, it’s best practice to have a crawl depth of 3 or less.
Similarly, it’s beneficial for your most important pages to be present in your sitemap as this makes it easier for crawlers to locate your content.
The Internal LinkRank (ILR) is based on the number of incoming internal links and the page crawl depth. Pages with higher Internal LinkRanks are more accessible, as they have a lot of incoming internal links and low crawl depth.
An Accelerated Mobile Page (AMP) is a webpage with simplified HTML that experiences faster loading speed so that users can gain quicker access to the page content from a mobile device.
If you have different versions of a page, you can use a canonical tag to point search engines to the preferred one; this way you will avoid negative impact on rankings for identical or duplicate content.
For example, if you have both a non-AMP and an AMP version of the same page, you will need to inform crawlers about it with link tags connecting these pages. If you only have an AMP version, it will still require a canonical tag that points to itself.
The Hreflang tag specifies the lingual and geographical targeting of a page. If you have localized versions of your website for different countries, you should carefully check the hreflang tags, to ensure that your audiences get the right content.
The HTTP Status Codes represent a server’s response to a user’s request. Pay close attention to the 4xx and 5xx status codes as these show that a page is unavailable due to some error.
HTML Load Time shows how long it takes to load the HTML code of the page. Website loading speed is a big part of the user experience and an important ranking factor. Pages’ slow loading can be caused by too big or too many JavaScript (JS) and CSS files.
Using proper markups in your HTML can help search engines and social networks identify the entities on your website and index your content more accurately.
By connecting your Google Analytics account you can get the information on the number of unique pageviews in the report. Identify the most viewed pages and fix them first.
You can find more detailed information about each of these attributes in the Statistics report of your Site Audit.
Individual URL report
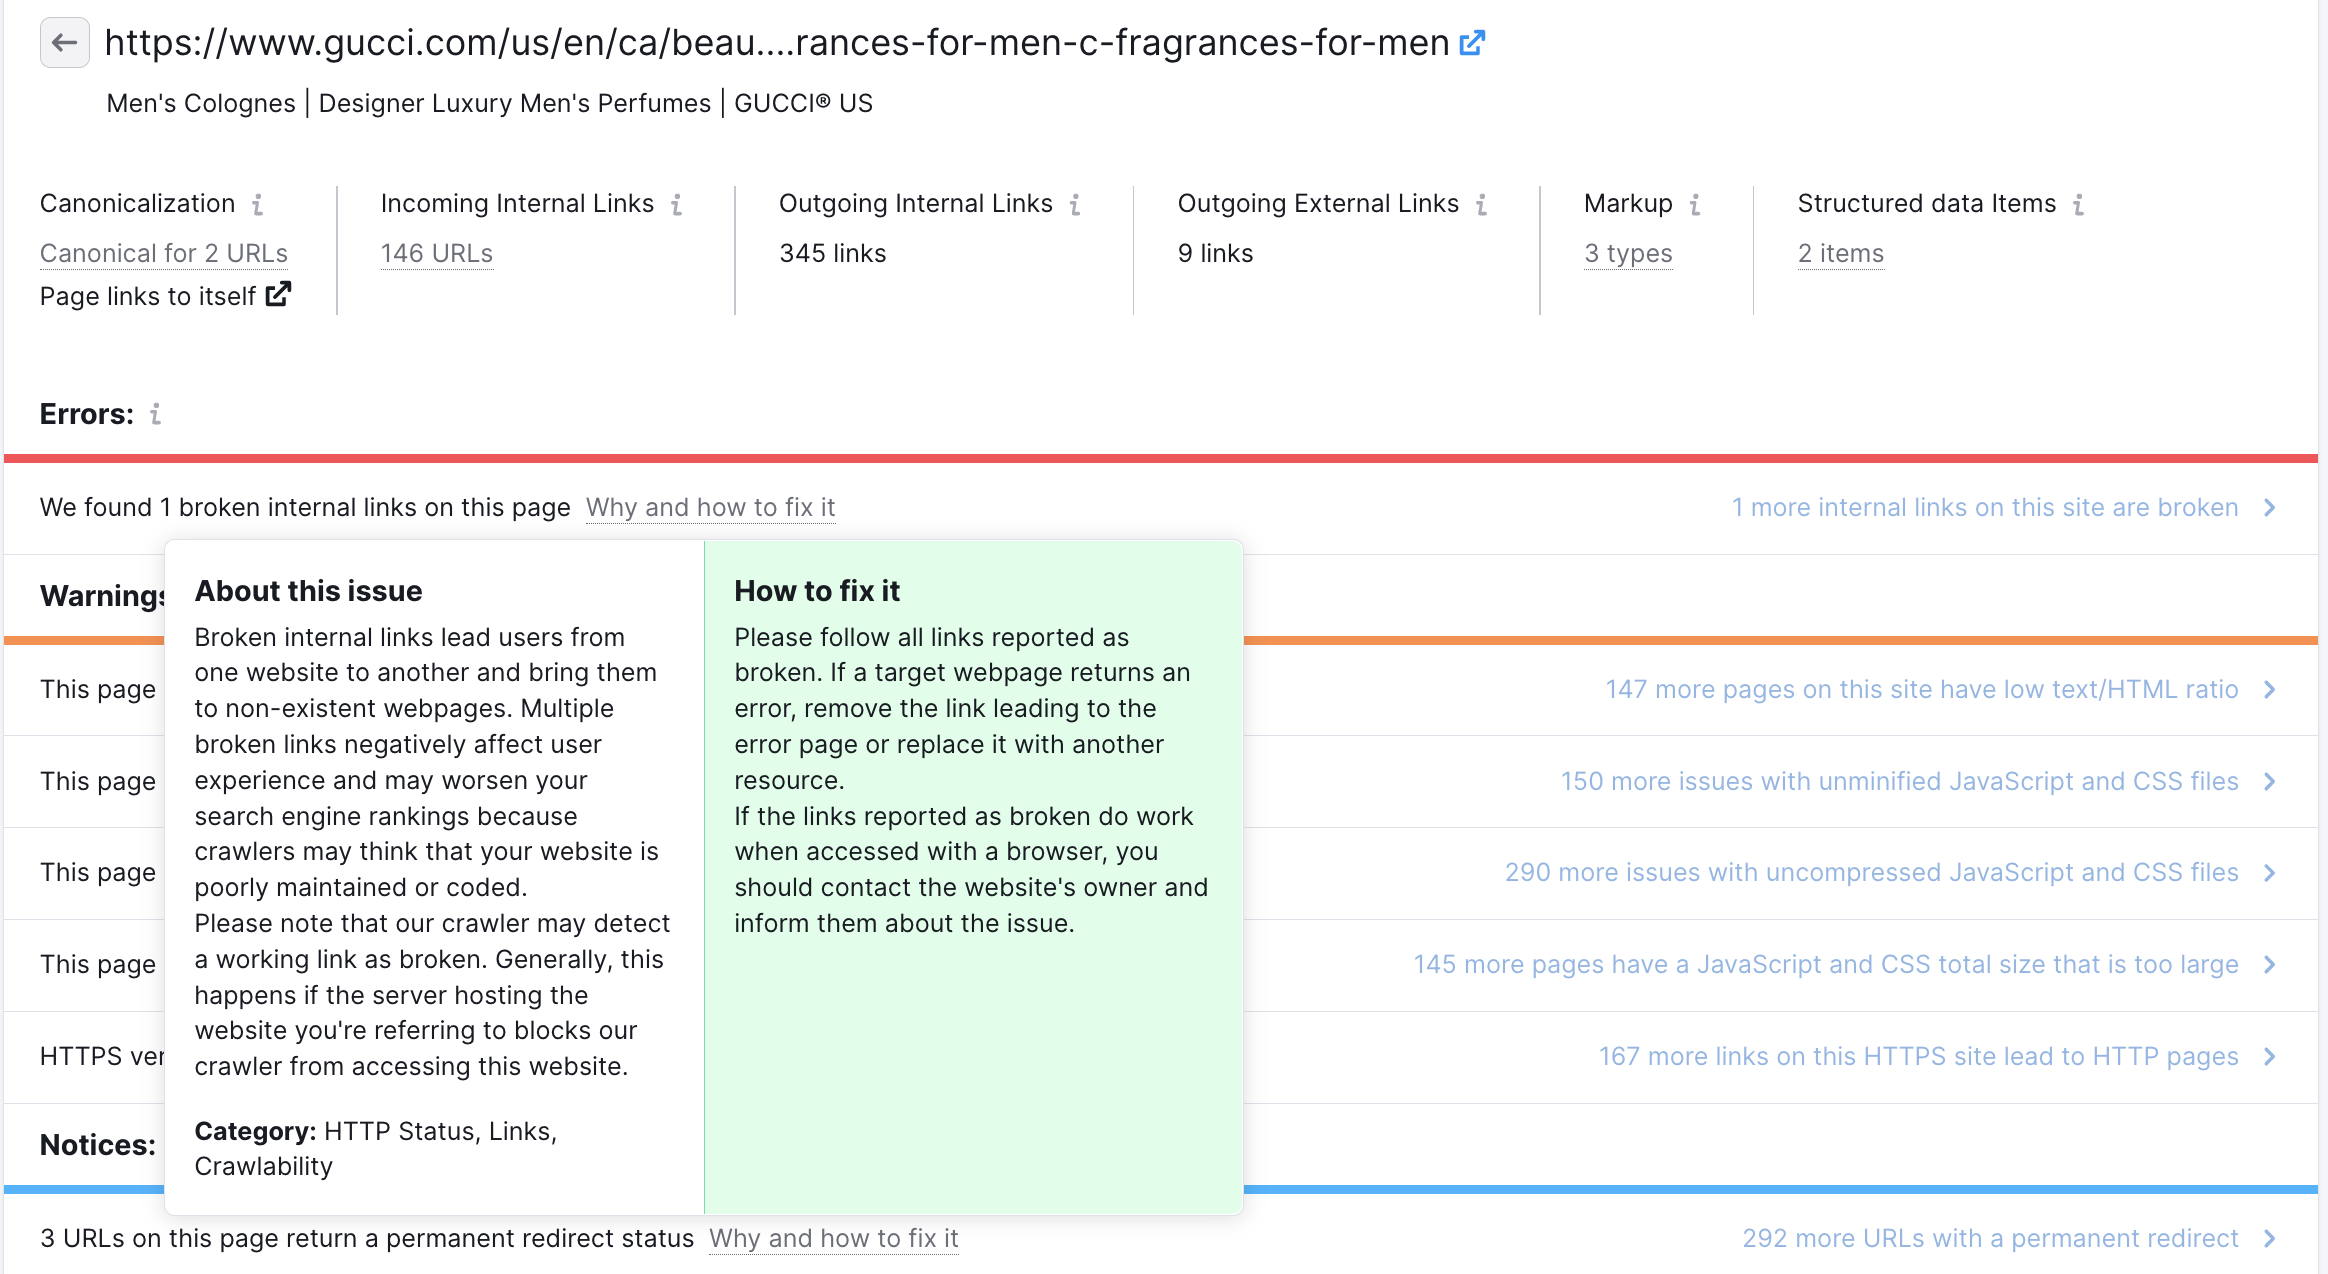
To see that page’s individual URL report, click on any URL in the table. The next page will list the errors, warnings, and notices and the number of incoming internal links discovered for each crawled page. Hover over the grayed-out metrics and notes for more information.

You can hover over the info button for an explanation of the issue, click on each for more details, or click on the link in the right column to see how many other pages on the site have the same issue.
You can also select the gray square and arrow icon beside the URL to open the webpage in a new tab.
Site Structure View
Switch to the Site Structure to get an overview of your website’s subdomains and subfolders and see which parts require more work.

Note that Site Audit composes your site’s structure from the pages it has crawled, so if you have limited the number of pages to check or selected a specific part of your website for audit, the result might differ from your actual site structure. You can always change the settings of your campaign to get the real picture.